Binding odata to our google chart
Introduction
This post is about drawing our Google chart using odata from our SAP backend / gateway service in answer to a question that I got from my previous post getting started with google charts in UI5.
Understanding my gateway entity set
Currently at my job I have hosted a couple of training sessions for new joiners/ people who are interested in learning UI5 and in that 2 day course I run through how to do CRUD operations, binding, routing etc. The gateway service that I have access to is related to that training in which we create a 'todo list' application and the metadata is as follows:
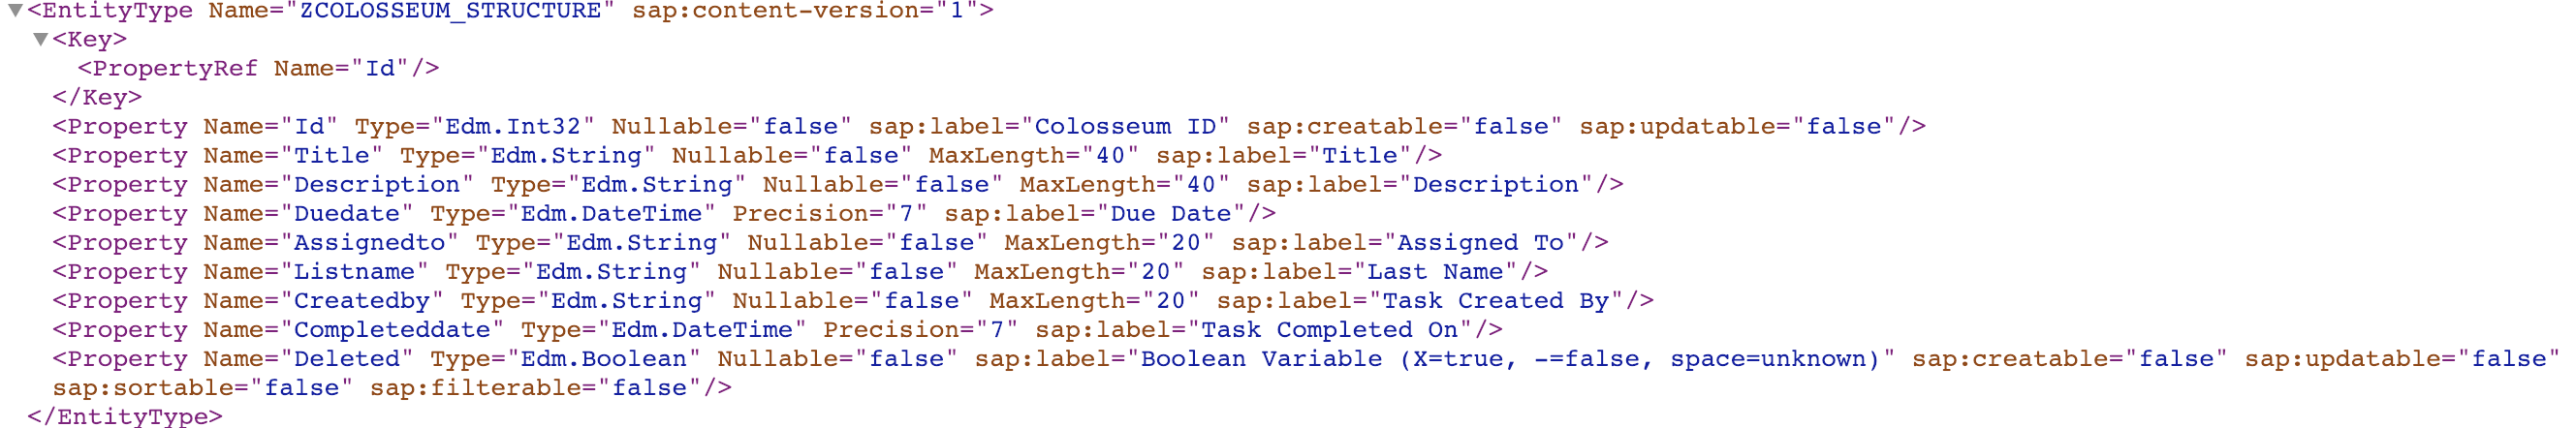
So this gateway service basically just returns a list of items in a z table with the above fields, I have my students separate their lists using the 'Listname' field and later on use that as a dynamic filter.
So coming back to the chart, Let's say that I want to return the listname and how many tasks are assigned to each listname and then display that in our pie chart to see who has the most tasks.
Getting our data
To get data from our SAP backend I'm going to be making use of Promises and the above gateway service. The call as discussed previously is going to return a promise, so nothing too exciting and I also need to throw a default filter on the call to give me all the non deleted items:
getMyData: function(){
    return new Promise(function(resolve, reject){
        var myDeletedFlag = myDeletedFlag === true ? true : false;
        var filters = [this.returnDeletedItemsFlag(myDeletedFlag)];
        this.getView().getModel("myService").read("/ToDoListSet", {
            filters: filters,
            success: function (data) {
                    resolve(data);
            }.bind(this),
            error: function (oError) {
                    console.log(oError);
            }
        });
    }.bind(this));
},
Mostly this call is entirely self explanitory, yours will likely look different but the basic structure is the same and we can see that I've simply encapsulated my odata call into a promise.
Making use of promise.all
So in my previous post I mentioned that when we load in the Google core chart that we're using a promise. I am also now using a promise in my function above of "getMyData". I also only want to call my "drawChart" function when we've loaded both the google chart and the data from our SAP backend and as such we're going to make use of promise.all().
Our updated call to google.charts.load now looks like the below and I have moved this call into our 'onAfterRendering' function as my odata service wasn't avaliable inside of my onInit function just yet.
var loading = google.charts.load('current', {'packages':['corechart']});
var myDataCall = this.getMyData();

Promise.all([loading, myDataCall]).then(function(promiseResolves){
        this.drawChartWithData(promiseResolves[1])
}.bind(this));
This simply places our two calls into variables and then allows us to act on their resolves/ when they're done loading and I then pass in the data from our oData call into the "drawChartWithData" function.
Drawing our chart
Our draw chart with data function looks very similar to our previous function of "drawChart" the only difference is that I call a function to manipulate our data to the format that we need for our chart. The updated function can be seen below:
drawChartWithData: function (data) {
    // Create the data table.
    var tasksPerList = this.returnListNamesWithNumberOfTasks(data.results)

    var data = new google.visualization.DataTable();
    data.addColumn('string', 'Listname');
    data.addColumn('number', 'NumberOfTasks');
    data.addRows(Object.entries(tasksPerList));

    // Set chart options
    var options = {
        'title': 'How many tasks exist per todo list',
        'width': 400,
        'height': 300
    };

    // Instantiate and draw our chart, passing in some options.
    var chart = new google.visualization.PieChart(this.getView().byId("myHBox").getDomRef());
    chart.draw(data, options);
},
As above the function is basically exactly the same, I have two columns in our data and 'tasksPerList' resolves in some key value pairs that I then convert into arrays. I'll go over our data manipulation below so you can see what I did but yours will likely differ.
Manipulating our data
This function isn't necessarily the "best" way to give us what we want but it seemed the easiest to read which is great for the purposes of a blog post:
returnListNamesWithNumberOfTasks: function (results) {
    var uniqueListNames = {};
        results.forEach(function (item) {
            var listName = item.Listname;
            listName = listName.toLowerCase();
            uniqueListNames[listName] = 1 + (uniqueListNames[listName] || 0);
        });
    return uniqueListNames;
},
I set everything to lower case in the above example so that data wasn't separated when the only differences were capitals at the start of the listnames.
Result
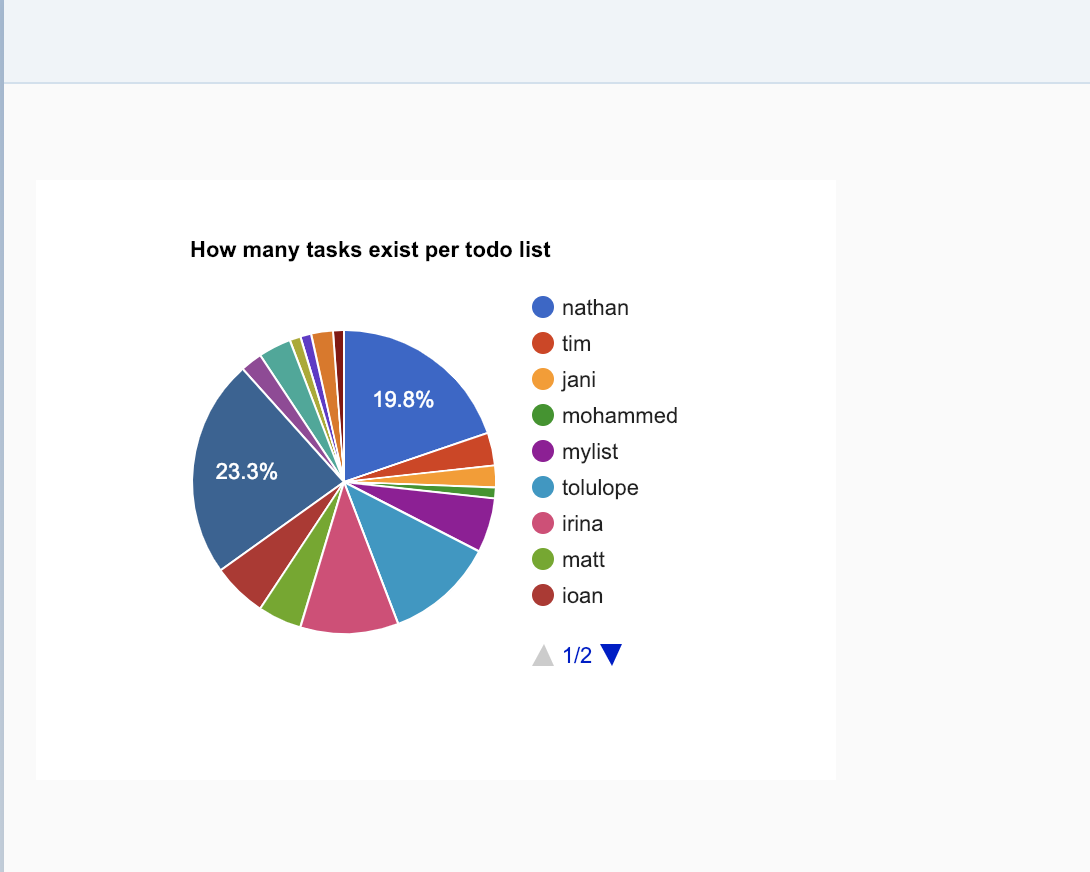
And there we have it, the data from our backend is now represented in our pie chart showing that I only have 19.8% of outstanding 'tasks' in our todo list application. Once again I suggest taking a look at the documentation for further updates/ different charts etc.
Feel free to leave a comment down below, this was a very quickly put together post based on asking how to implement odata in this chart from the question i answered.
···
