Getting started with google charts in UI5
Introduction
You will at some stage working with UI5 want to make use of graphs, charts and other visual representations of data in your application. When using SAPUI5 you can make use of Vizframe and other build in chart solutions but this isn't avaliable to OpenUI5 and honestly I don't like working with Vizframe.
So having said that we want to make use of alternative chart libraries and this post will focus on the use of Google charts. If you want to look into how to use Chart.js then have a look at my other blog post over here.
Getting started
So getting started I’m going to use a blank application, once again I’m using ExpressUI5 (disclaimer I made this). You can just implement this into your existing project as well as I'll go over all the steps but so you know where I'm starting from.
Loading in Google charts
I'm going to load in Google charts using the CDN, but you could also download it and load it in like how we loaded in our barcode generator.
So in your index.html file simply add the following line around the same location as your other scripts that load with UI5.
<script type="text/javascript" src="https://www.gstatic.com/charts/loader.js"></script>This will load in from Google the chart loader at the start of our application.
Adding our XML
Google charts much like in our post about the bardcode needs to know where we're going to place the chart in our application. In my example I'm going to place it inside of a HBOX and give it an id of "myHBox" looking like this:
<HBox id="myHBox">
</HBox>
A HBox is just a Div with a horizonal layout, quite useful for building our forms but for now I'm just using an essentially blank place to tell Google charts where to go.
Loading up our chart in our controller
Seen as we should have loaded out Google charts loader into the application at the start in the index.html we need to go ahead and use the 'Google' keyword and add in the following line:
google.charts.load('current', {'packages':['corechart']});The above will then load in our 'corechart' package, this will actually trigger a call and so we need to deal with the callback. I have previously mentioned that I hate the use of callbacks in UI5 in our post about Promises . Conveniently for us this load is treated as a promise and so we can instead change our code to the following:
var loading = google.charts.load('current', {'packages':['corechart']});

 loading.then(function(){
  this.drawChart()
}.bind(this));
The additional benefit of a promise here could be that if I want to draw my chart with data that needs to be loaded from our SAP gateway server/ backend system I can wait for both calls and use a promise.all() to then call our drawChart function.
Drawing our chart
Inside of our controller we're going to make our 'drawChart' function and it's going to look like this:
drawChart: function () {
            // Create the data table.
            var data = new google.visualization.DataTable();
            data.addColumn('string', 'Topping');
            data.addColumn('number', 'Slices');
            data.addRows([
                ['Mushrooms', 3],
                ['Onions', 1],
                ['Olives', 1],
                ['Zucchini', 1],
                ['Pepperoni', 2]
            ]);
            // Set chart options
            var options = {
                'title': 'How Much Pizza I Ate Last Night',
                'width': 400,
                'height': 300
            };
            var HBoxDomRef = this.getView().byId("myHBox").getDomRef();
            // Instantiate and draw our chart, passing in our HBox.
            var chart = new google.visualization.PieChart(HBoxDomRef);
            chart.draw(data, options);
        },
The important part in the above which references earlier is the use of "this.getView().byId("myHBox").getDomRef();" as this is getting our HBox which is needed for the chart to be inserted into the correct position in our XML view.
The result
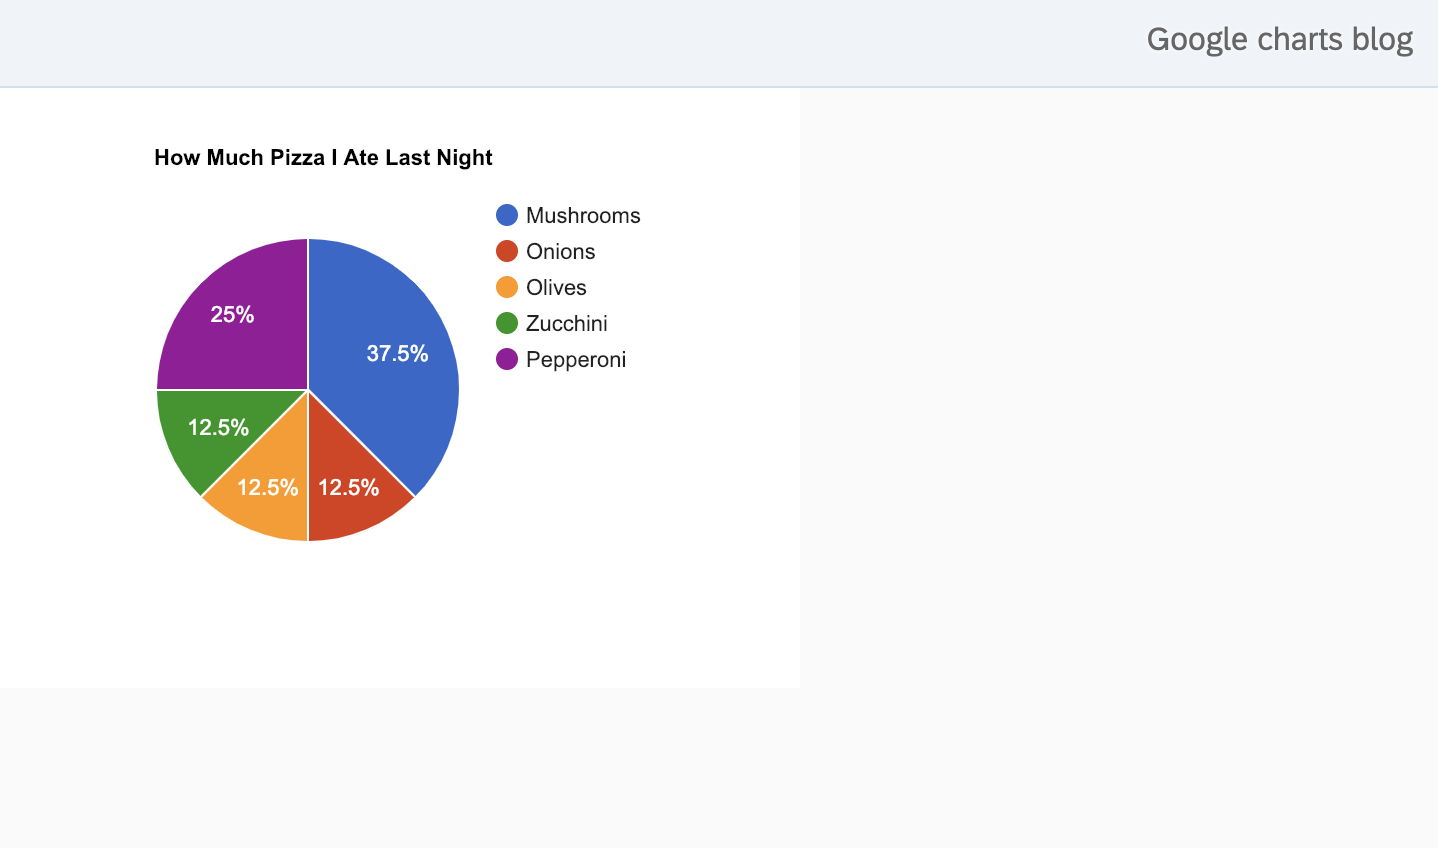
And there we have it, we've successfully included and drawn a chart using Google charts in UI5. This is a great start and to customize the chart further I suggest taking a look at the documentation.
Feel free to leave a comment down below, this was a very quickly put together post based on a question I answered as I found other blogs on the subject to be using the older and no longer recommended JavaScript Views.
Adding odata to our chart
If you're interested in learning how to add odata to our chart then I've followed up this post with another one binding odata to our google chart.
···
